


BRIDGEcereal workflow
Red outline denotes steps with parameter selected based on user’s discretion. The brackets indicate the steps involved in CHOICE and CLIPS algorithms.
Hover your mouse over boxed text to view details.
Use gene ID and CDS
Step 1
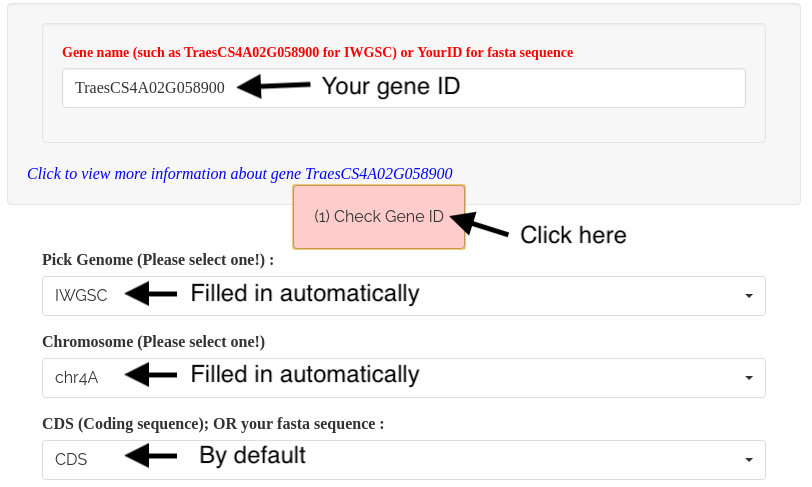
1). Input the gene model ID in the Gene name box, then click '(1) Check Gene ID' button to fill the boxes for reference and chromosome. A hyperlink, connected to the corresponding crop’s genomic database, will be available (in blue color) for the query gene ID.
*** Update (02-24-2024): Input transcript model ID in the transcript name box, such as TraesCS4A02G058900.1 or TraesCS4A02G058900.2 for IWGSC.
Step 2
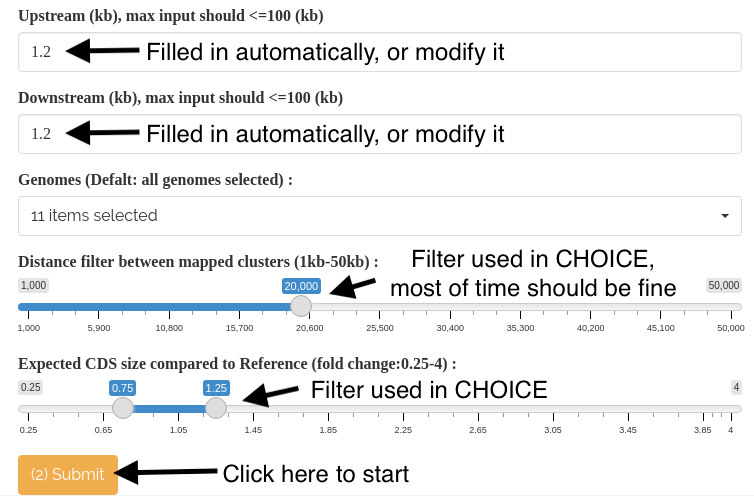
2). Adjust the values for the Upstream and Downstream boxes to define the search boundaries, with a maximum input limit of 100kb. By default, the Upstream/Downstream input (in kb) is set at 10% of the target gene size. Choose the Genomes to be included in the analysis by selecting or deselecting them (all pan-genomes are selected by default). Click the '(2) Submit' button to initiate the process. The alignment with the selected genomes will be displayed in the top right panel (as Panel 1).
For more information about the two default parameters, please refer to the 'Two default CHOICE parameters explained' part in 'BRIDGEcereal additional instructions'.
Panel 1:
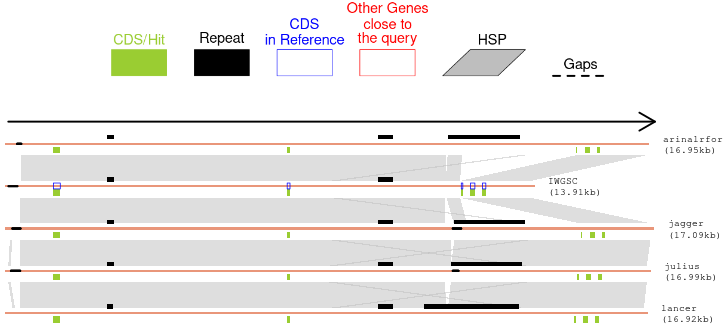
*** After Panel 1 is revealed, you can modify the sizes (in kb) of the Upstream and Downstream regions for the query gene. Simply input your preferred sizes in the corresponding Upstream and Downstream boxes, and BRIDGEcereal will automatically update the results and Panel 1 with the new information. There is no need to click the '(2) Submit' button again.***
Step 3
Panel 2:
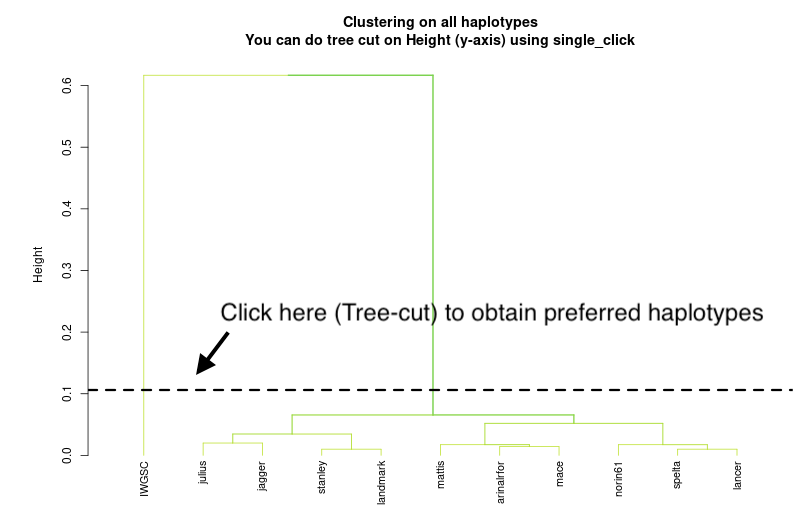
3). To plot the phylogenetic tree clustering genomes based on shared indels, click the '(3) Tree' button, which will display Panel 2. To determine the number of haplotypes based on your tree-cut, click on the tree plot in the top right corner. *** If your tree-cut does not meet your satisfaction, you can click the '(3) Tree' button again and perform a new tree-cut at your preferred branches.***
Step 4
4). Click the '(4) Plot selected haplotypes' button to plot the alignment among genomes representing each haplotype (Panel 3).
Panel 3:
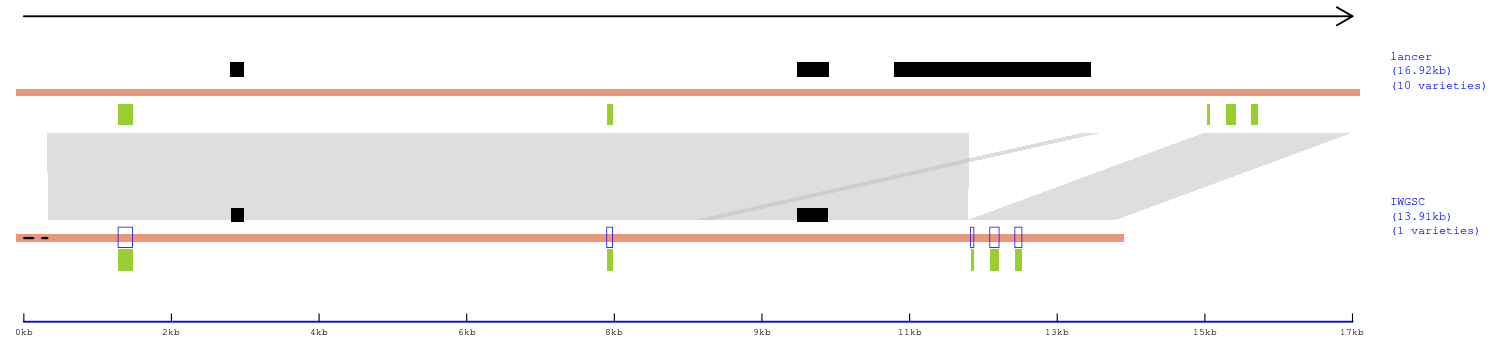
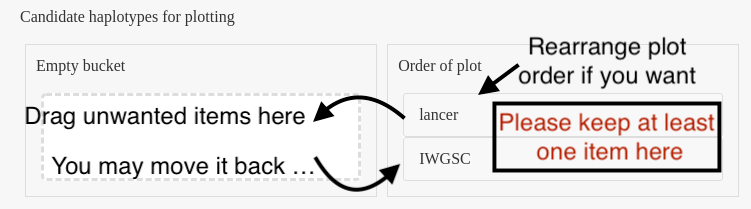
*** You can rearrange the preferred plot order in the left bucket by dragging and dropping the haplotypes. Additionally, if you want to remove unwanted haplotypes from the plot, simply drag them from the 'Order of plot' bucket to an 'Empty bucket'. The Panel 3 will be automatically updated based on the new input.***
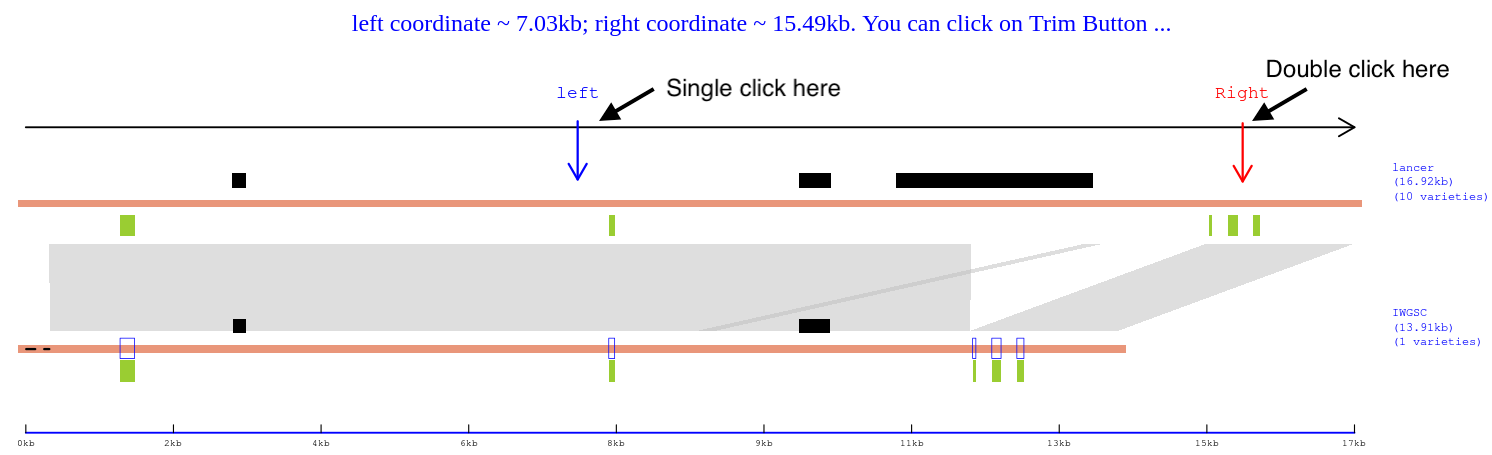
Step 5
5). To remove unwanted regions from the final haplotype presentation, single click on the third panel (Panel 3) to set the left boundary, and then double click to set the right boundary. Once both boundaries are set, the '(5) Trim' button will become clickable. Click this button to view Panel 4, which will show the trimmed presentation.
Panel 4:
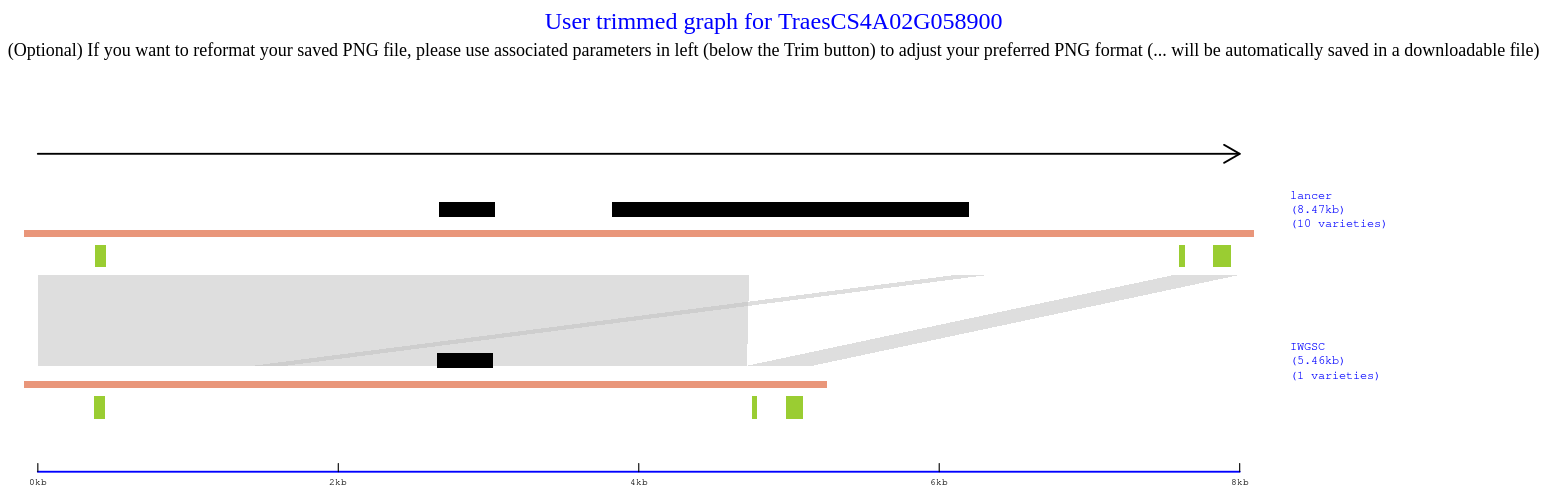
(Optional) If you want to extract the DNA sequence within the trimmed region, simply click on the 'Extract trimmed fasta' button. This will generate a fasta file containing representative haplotypes and their corresponding DNA sequences. The file will be saved in a final downloadable .zip file.
*** After trimming, click the 'Save .zip file to...' button to save a .zip file to your preferred folder. The trimmed Panel 4 will be included in the .zip file in PNG format. If the saved PNG figure is not satisfactory or needs improvement, you can adjust it using the PNG parameters on the left-hand side (slider bars for width, height, and point size). This output and save process is automated, and you will find an updated Panel 4 (PNG) in a new .zip file folder. ***
(Optional). Click red 'Done' button to delete your submitted job and related files.
Demo video
BRIDGEcereal additional instructions